95th Percentile vs Number of Samples
The 95th Percentile is a statistical metric widely used in various fields, with emphasis in computer networks and telecommunications, to measure and bill bandwidth usage and to monitor system performance.
What is a Percentile?
Section titled “What is a Percentile?”A percentile is a measure that indicates the value below which a given percentage of observations in an ordered data set falls. For example, the 50th percentile is the median, the value below which 50% of the data lie.
95th Percentile in Computer Networks and Telecommunications
Section titled “95th Percentile in Computer Networks and Telecommunications”In the context of networks, especially for Internet Service Providers (ISPs) and companies that purchase dedicated links, the 95th Percentile is a methodology for measuring and billing data traffic. The idea is to offer a more flexible and fair billing model that accommodates occasional usage spikes without penalizing the customer with excessive costs.
How does it work?
Section titled “How does it work?”- Data Collection: Bandwidth usage is monitored and sampled at regular intervals, usually every 5 minutes, over a period of time (typically a month). Each sample represents the average bandwidth used during that interval.
- Sorting: At the end of the measurement period, all of these samples are collected and sorted in ascending order, from the lowest bandwidth usage to the highest.
- Dropping the Peaks: The top 5% highest bandwidth usage values are discarded. This means the highest and most sporadic traffic spikes, which could inflate the cost, are not considered in the billing.
- Calculating the 95th Percentile: The next highest value after dropping the top 5% is the 95th Percentile. This is the value that will be used for billing. In other words, 95% of the time, bandwidth usage was at or below this value.
Impact of Sampling Granularity on the 95th Percentile
Section titled “Impact of Sampling Granularity on the 95th Percentile”In data traffic monitoring, the sampling granularity — that is, how frequently data are collected — has a direct impact on the 95th percentile value. In the experiment below, we observed that the 95th percentile was higher in monitoring with sampling every 1 minute compared to monitoring with sampling every 5 minutes.
This occurs due to the inherent ability of more frequent sampling to capture faster variations and usage spikes. Let’s detail this technically:
Sampling Every 1 Minute: More Accurate Capture of Spikes
Section titled “Sampling Every 1 Minute: More Accurate Capture of Spikes”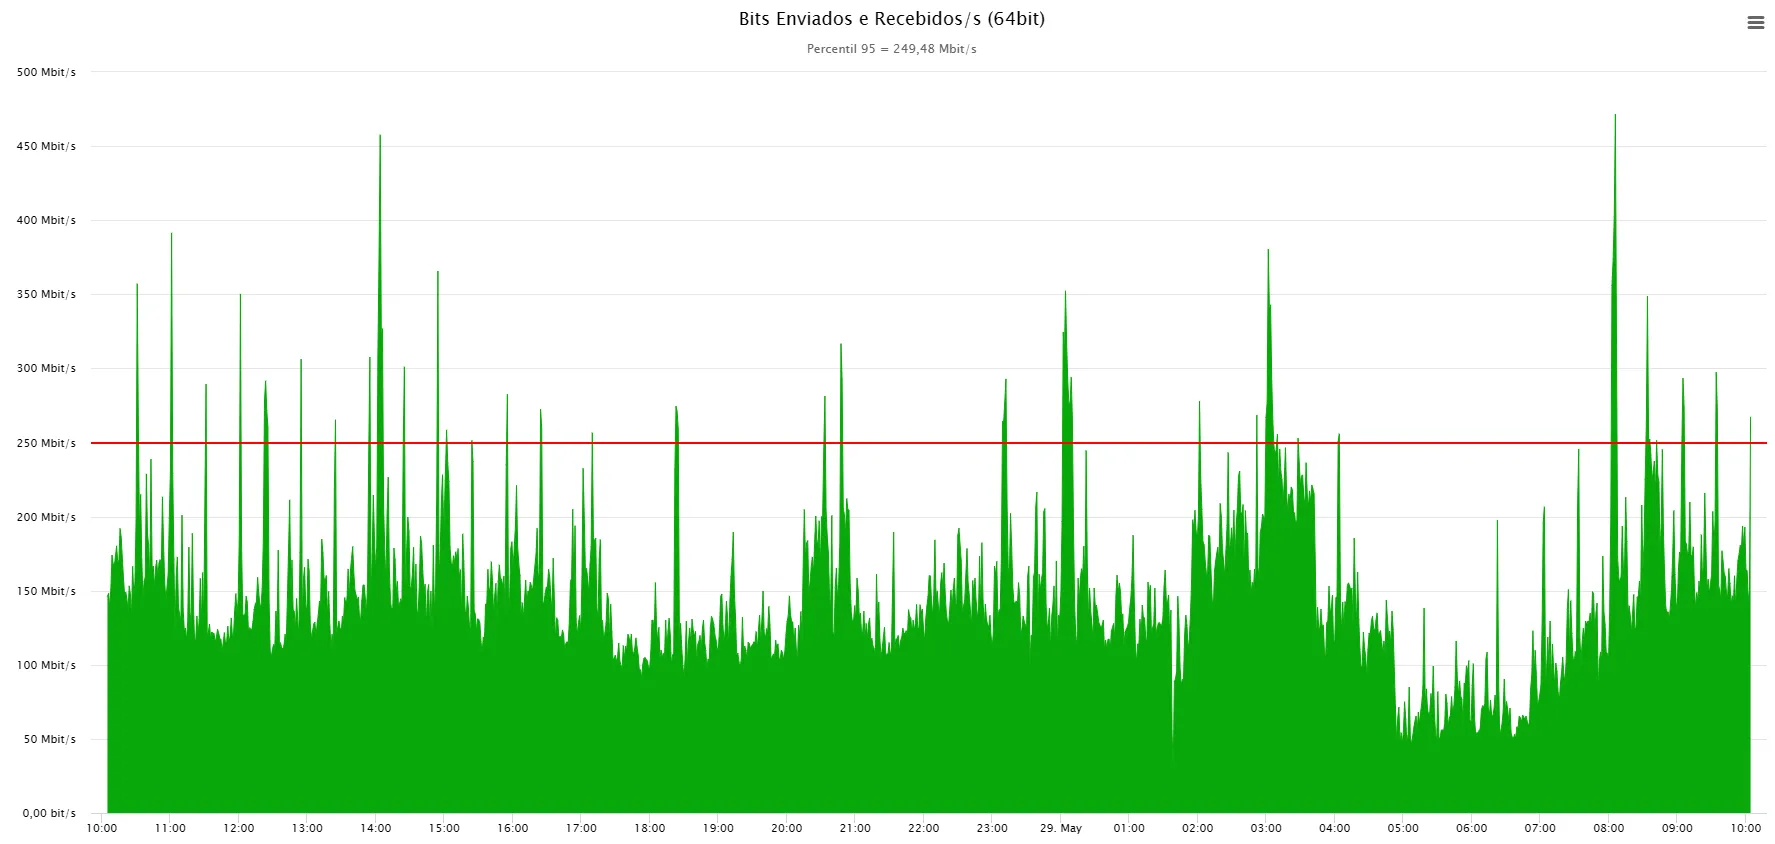
When data are sampled every 1 minute, the monitoring system records traffic in very short intervals. This allows it to capture transient and short-duration usage spikes with greater accuracy. Imagine a scenario where there is a sudden increase in data traffic lasting 30 seconds and then it returns to normal levels. A 1-minute sampling has a high probability of registering that spike, since the collection interval is small between samples.
Sampling Every 5 Minutes: Smoothing of Spikes
Section titled “Sampling Every 5 Minutes: Smoothing of Spikes”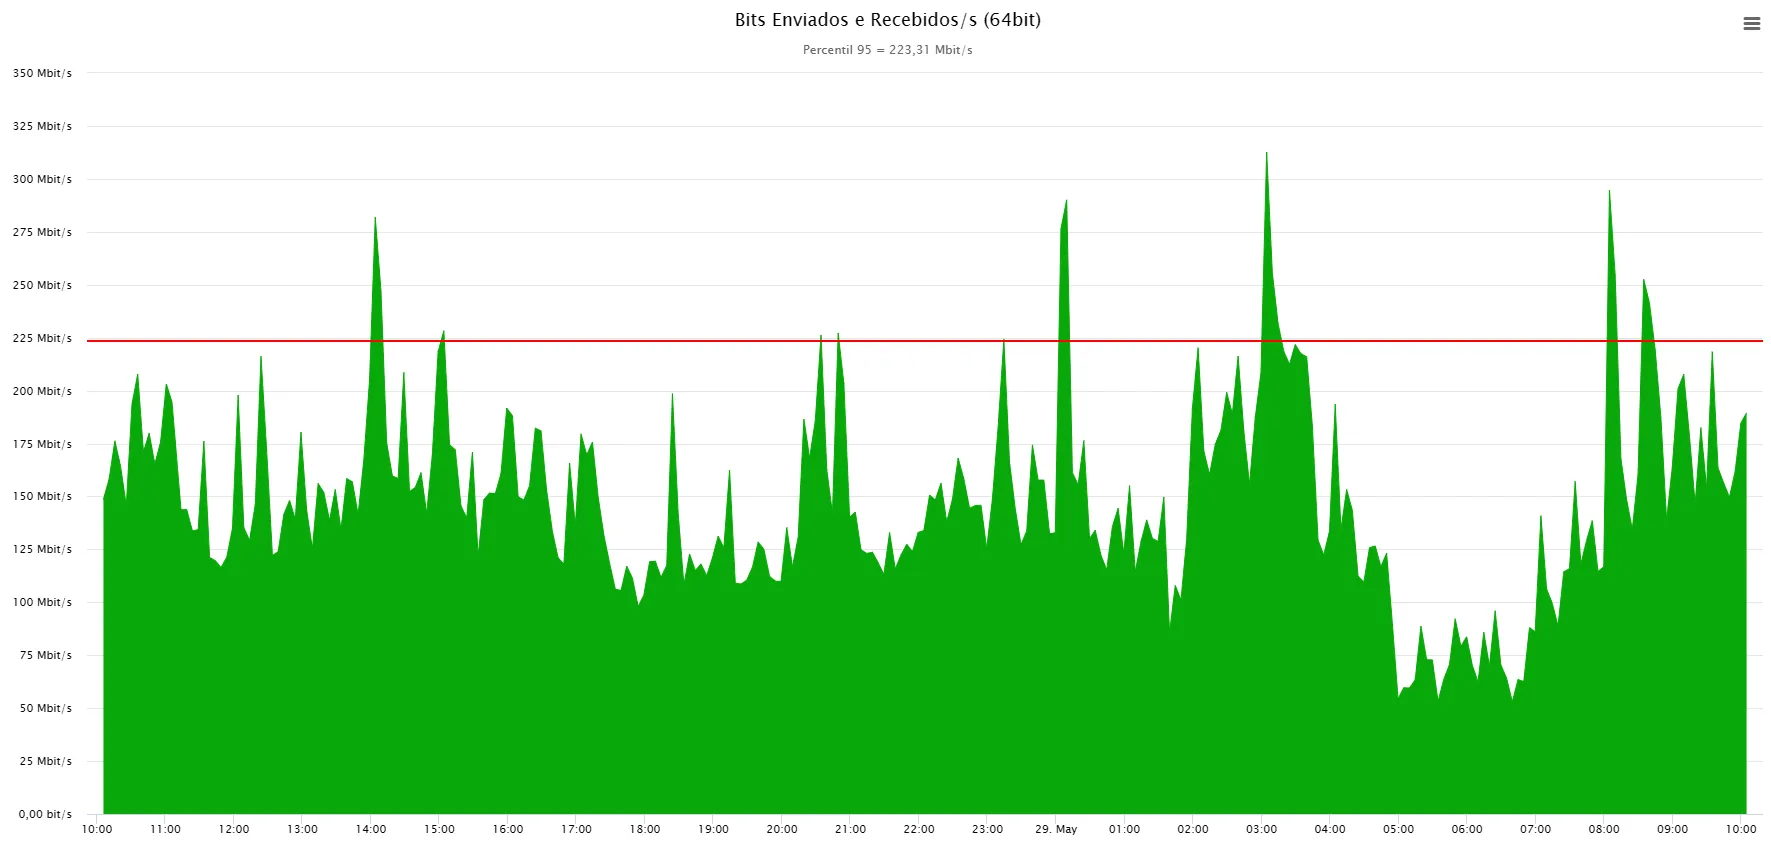
On the other hand, when sampling is performed every 5 minutes, the system calculates an average of the data traffic over a 300-second period. This longer averaging period inherently smooths out usage spikes. If a short-duration traffic spike (for example, 30 seconds) occurs within a 5-minute interval, its impact is diluted by the average over the remaining 4 minutes and 30 seconds of potentially lower traffic.
Technically speaking, each 5-minute sample is an aggregated representation of traffic in that interval. The lower sampling frequency results in a more “smoothed” dataset where rapid variations are less noticeable. Extreme values (the spikes) are “flattened” due to averaging over a longer period, which results in a lower 95th percentile. This does not mean the spikes do not exist, but rather that coarser sampling does not record them with the same fidelity.
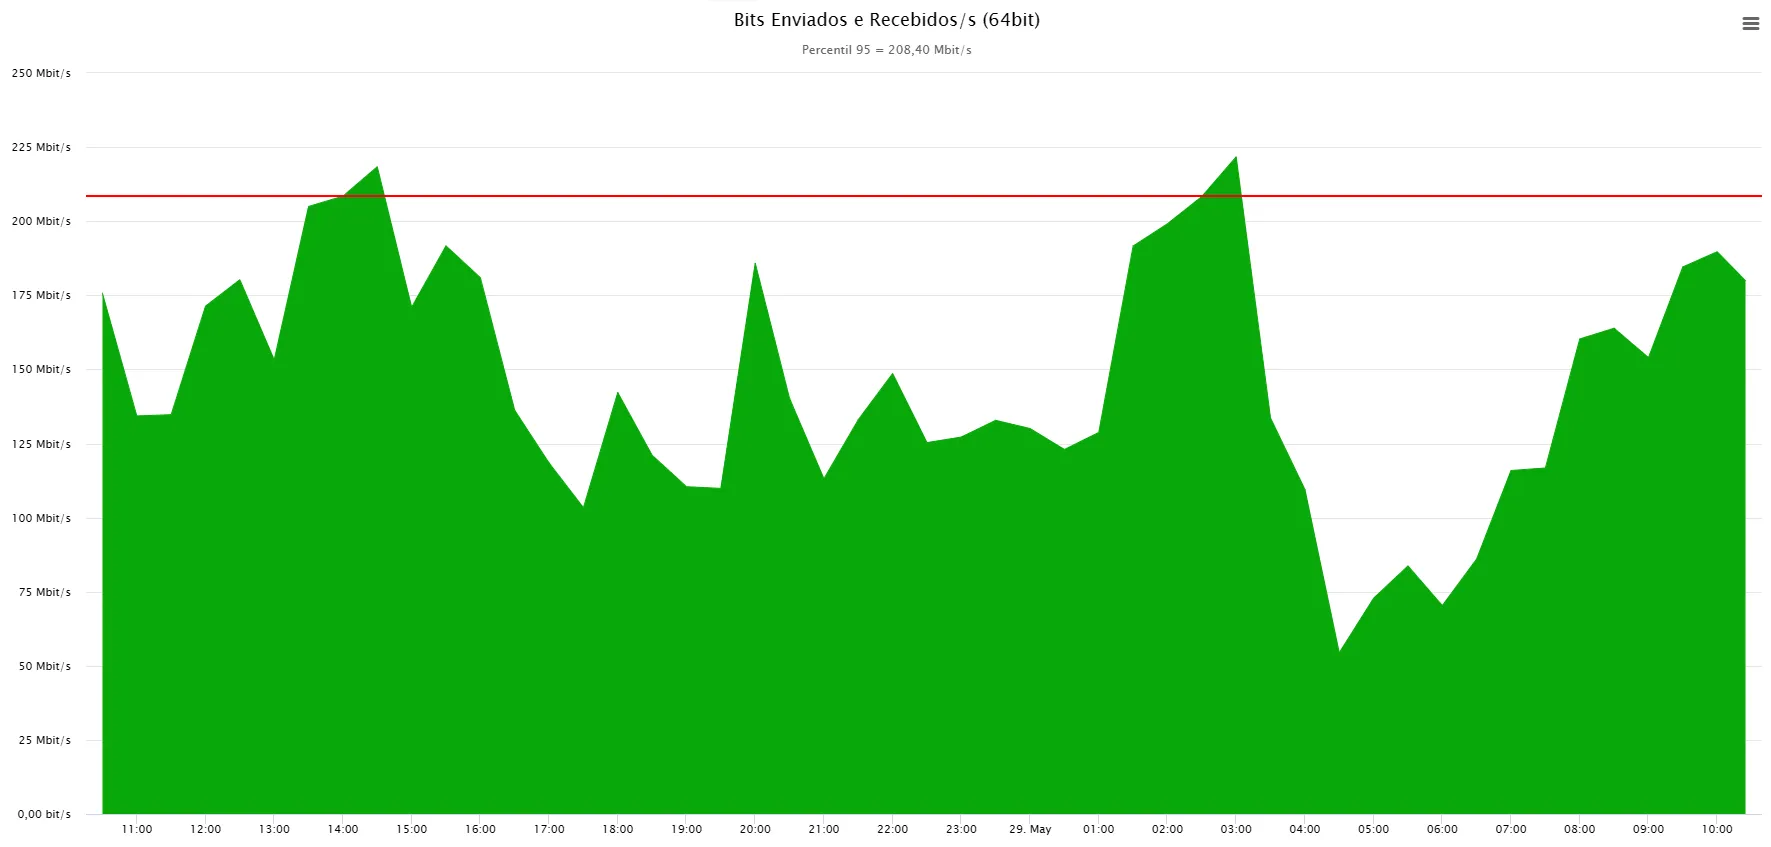
As an example, the chart below uses a sampling interval of every 30 minutes. The difference in the 95th percentile compared to the other samplings is considerably attenuated:
Conclusion
Section titled “Conclusion”The choice of sampling granularity in data traffic monitoring is crucial and depends on the objectives of the analysis. For accurate and timely detection of usage spikes and to understand the network’s burst capacity, a more granular sampling (such as every 1 minute) is preferable, even if it results in a higher 95th percentile. This provides a more detailed and faithful view of network behavior during high-demand moments. If the goal is to have a more consolidated and stable view of average traffic and to discard very rapid fluctuations, a less granular sampling (such as every 5 minutes) may be sufficient. It is important to be aware that samples with large intervals can underestimate the true magnitude of usage peaks.