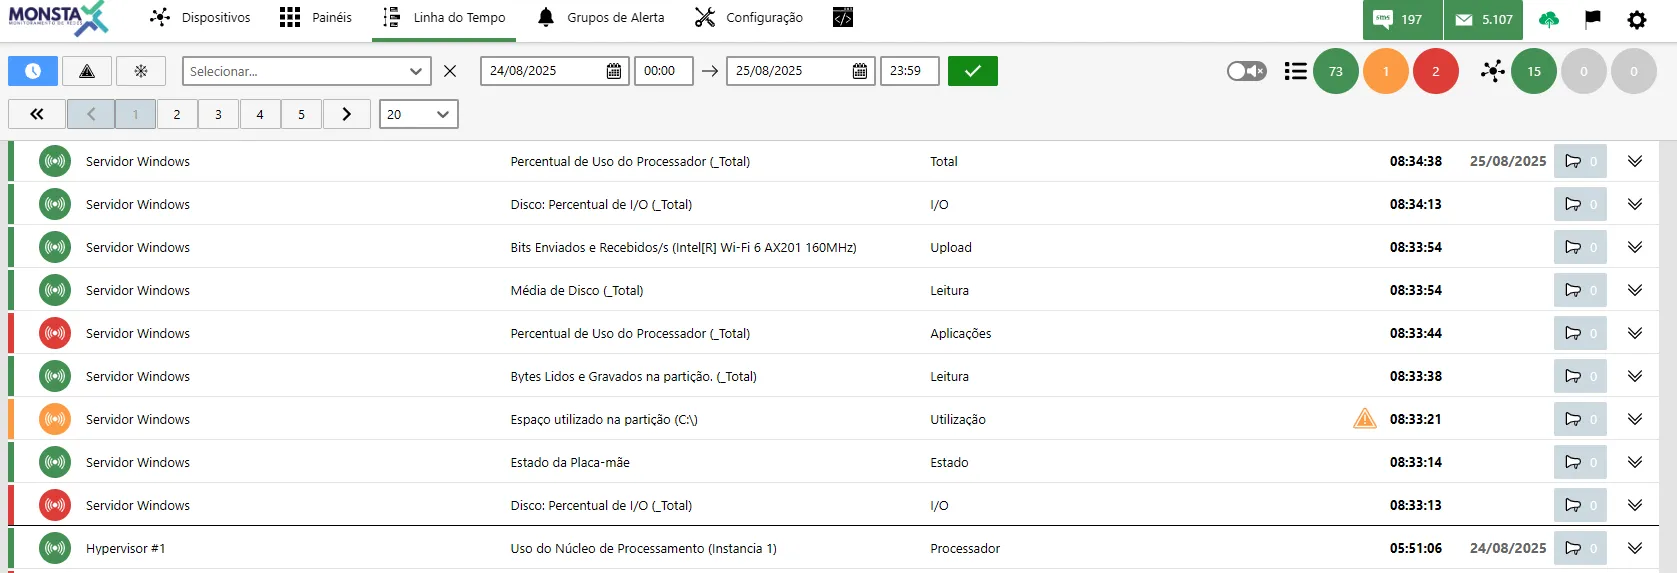
Timeline
The Timeline is a tool that transforms the continuous recording of data into a visual, chronological representation of all events and changes that occurred in the monitored infrastructure.
Search Filters
Section titled “Search Filters”| Ícone | Descrição |
|---|---|
| Real time: Shows changes that occur on devices and monitors in real time. | |
| Unresolved event: When active, lists only events that are not in the normal state. | |
| Pause: Freezes the current screen for viewing. |
![]()
![]()
Available Information
Section titled “Available Information”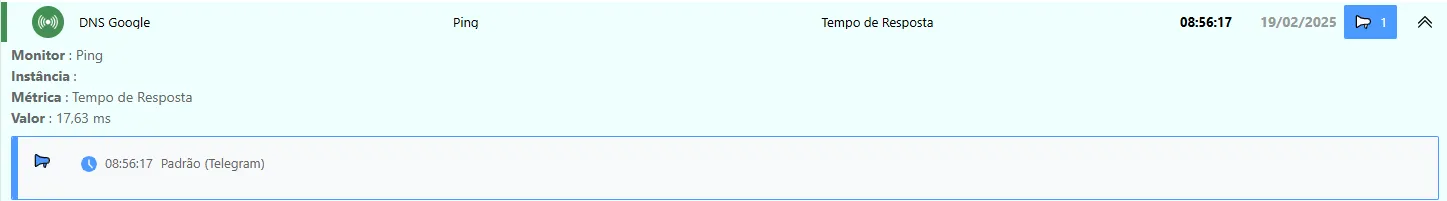
![]()
| Status | Descrição |
|---|---|
| The device/monitor returned to the normal state. | |
| The device/monitor is collecting data and is operating but with values in a warning state. | |
| The device/monitor is collecting data and is operating but with values in a critical state. | |
| The device/monitor is unable to report information related to data collection. | |
| The device is unreachable due to a problem with another device above it in the network hierarchy. |
| Info | Description |
|---|---|
| DNS Google | Device: Name of the device where the status change occurred. |
| Ping | Monitor: Name of the monitor where the status change occurred. When the monitor has an instance, its name is shown next to it in parentheses. |
| Tempo de Resposta | Metric: Name of the metric where the event occurred. |
| Unresolved event: When this icon appears, it means this event has not yet returned to the normal state. | |
| Event time: Shows the date and time the event was detected. | |
| Alert: Indicates whether any alert was triggered during the event. The groups to which the alert was sent will be listed in the event details. | |
| Details: Expands or hides the event details. |