Map View
The map view enables a geographic or logical interpretation of the IT infrastructure, facilitating the visual identification of the network topology. In Monsta, you have two operating modes: the Dynamic Map and the Static Map
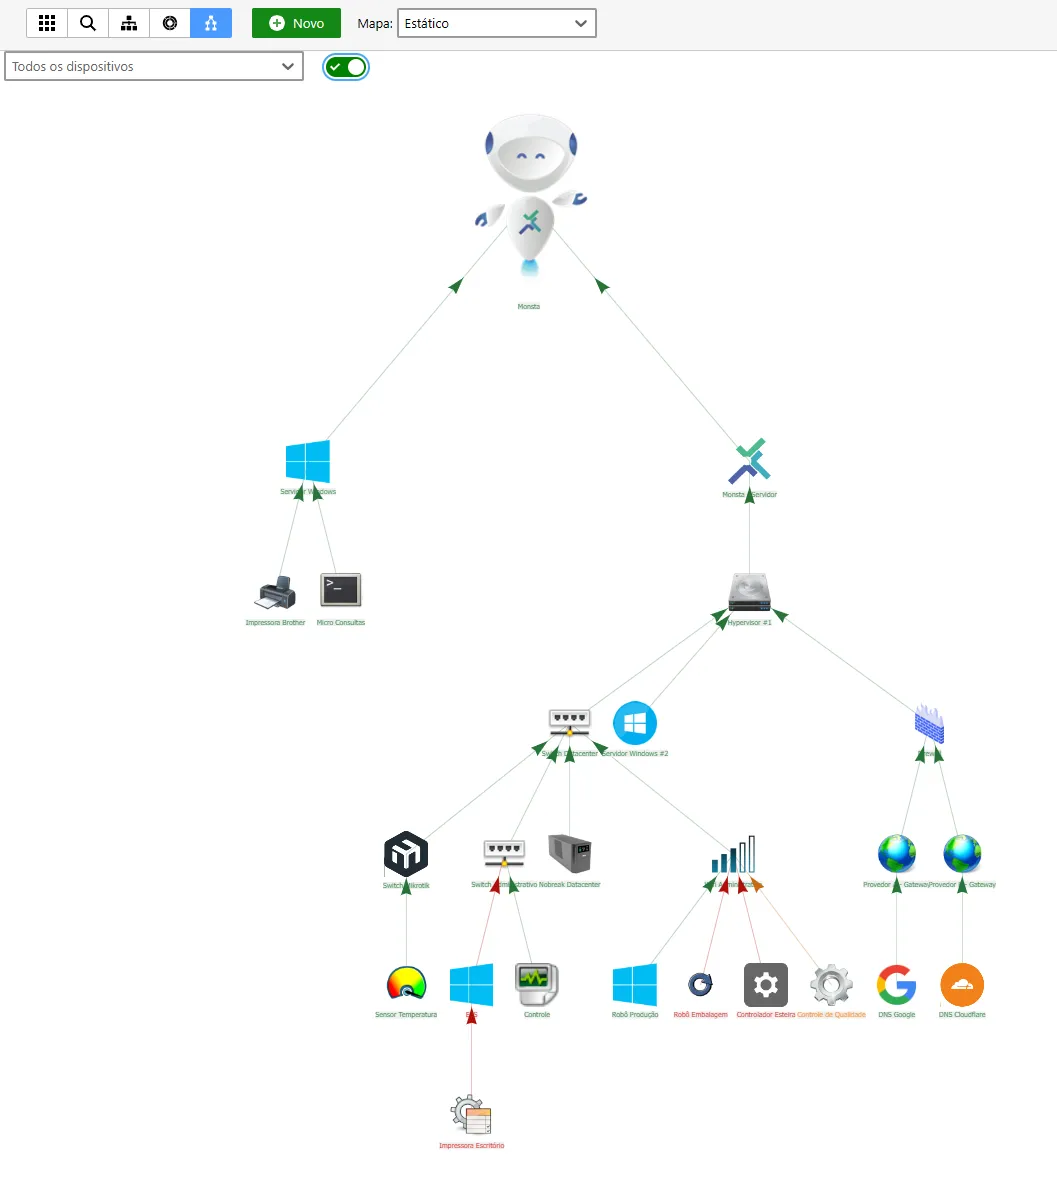
Static Map
Section titled “Static Map”This mode offers a simplified and optimized view of the infrastructure.
- Interactivity: Icon positions are fixed and determined by the system hierarchy. The user can enable or disable the display of device icons via filters.
- Customization: Does not allow moving items or inserting widgets, keeping the interface clean and focused on asset status.
- Application: Recommended for visualizing large volumes of devices and large-scale infrastructures that require high loading performance.
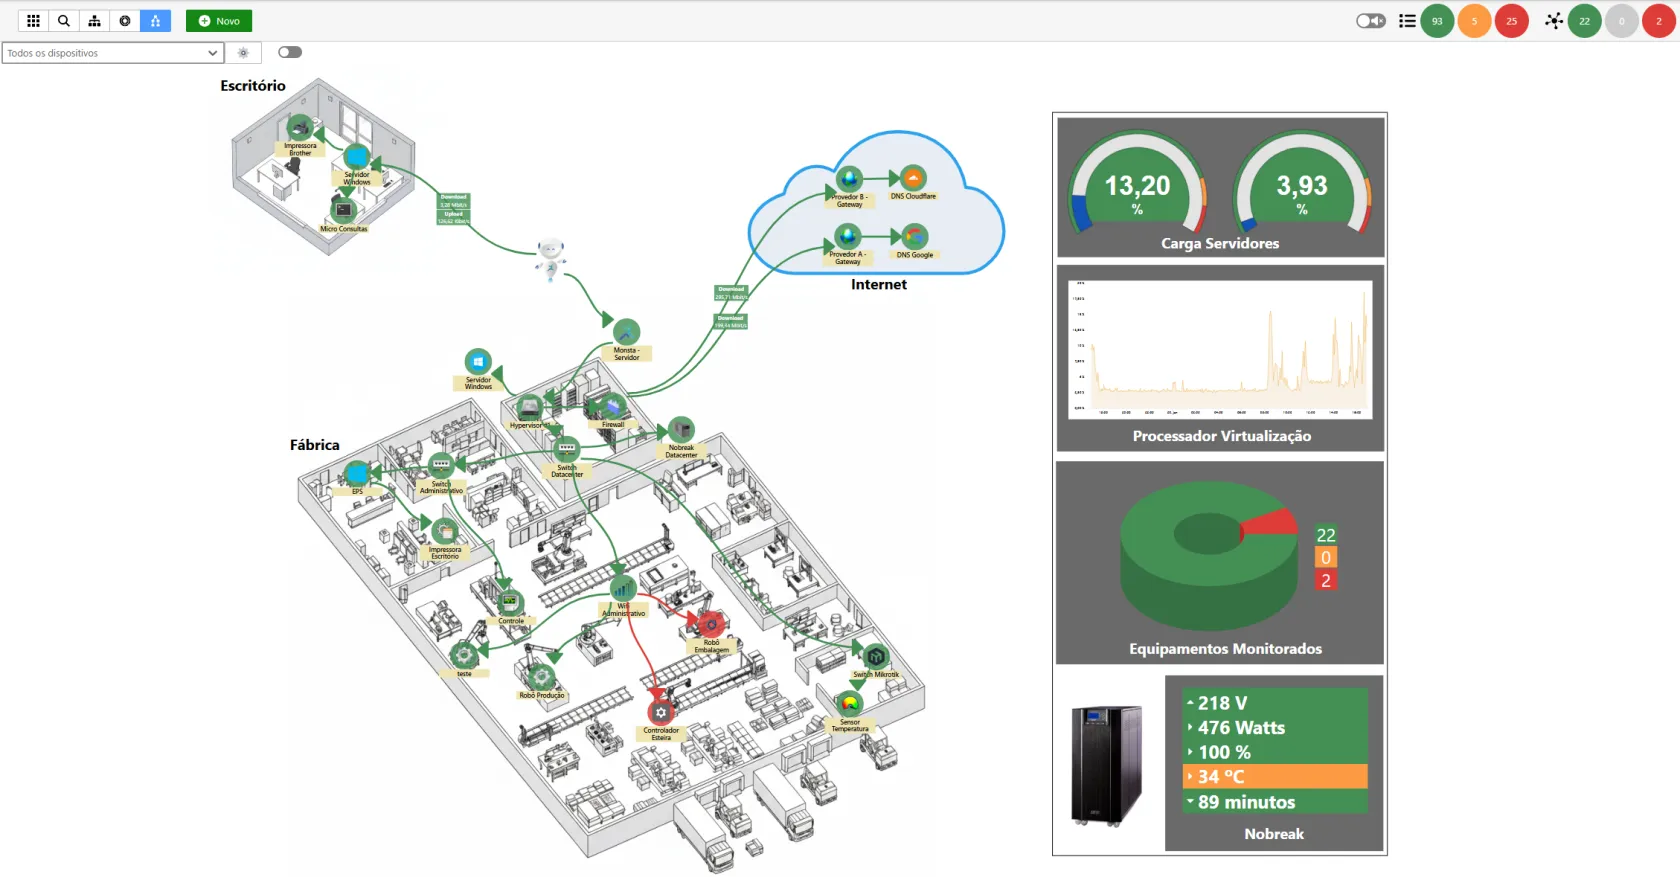
Dynamic Map
Section titled “Dynamic Map”This mode allows full customization of the network’s visual layout.
- Interactivity: The user can freely move device icons and position them manually on the map.
- Customization: Allows the insertion of widgets and additional graphical elements.
- Application: Ideal for creating personalized monitoring dashboards and networks that require specific visual organization.
Organization and Positioning
Section titled “Organization and Positioning”The map offers complete layout freedom so the digital representation can faithfully match the physical installation:
- Free Movement: Click and drag any device to position it manually in the desired quadrant.
- Layout Persistence: The layout defined by the user can be saved at any time, ensuring that the organization is preserved across sessions.
Dependency Management (Hierarchy)
Section titled “Dependency Management (Hierarchy)”The hierarchical structure defines the parent-child relationship between devices.
- Changing Hierarchy: To modify a device’s parent node, click on the parent device node and drag the mouse to the new child device.
- Logical Impact: When changing an asset’s parent, the system automatically updates the dependency tree and the alert propagation rules associated with that branch.
Widget Enrichment
Section titled “Widget Enrichment”The map allows inserting Widgets directly into the viewing area:
- Real-time Monitoring: Add data blocks, performance charts, indicators and more alongside devices.
- Dashboard Customization: Widgets can be resized and positioned strategically to highlight critical metrics of specific assets without needing to navigate to other menus.
![]()
![]()
- Elements: Adjust the size and shape of device icons and texts.
- Identification: Enable or hide the display of images.
- Connectivity: Select different arrow types and link styles to represent network connections.
![]()
- Spatial Organization: Reposition devices freely via drag-and-drop to reflect the physical or logical topology.
- Connection Metrics: Insert performance indicators directly on the link lines between devices.
- Widget Enrichment: Add extra visual components (charts, gauges, etc.) to create a complete and personalized monitoring dashboard.
- Reorganize positions: Automatically reset the positioning of all devices according to the hierarchy defined in the system.