Templates
A template is the set of resources that can be monitored on a device. Each vendor provides its own resources per equipment.
Templates
Section titled “Templates”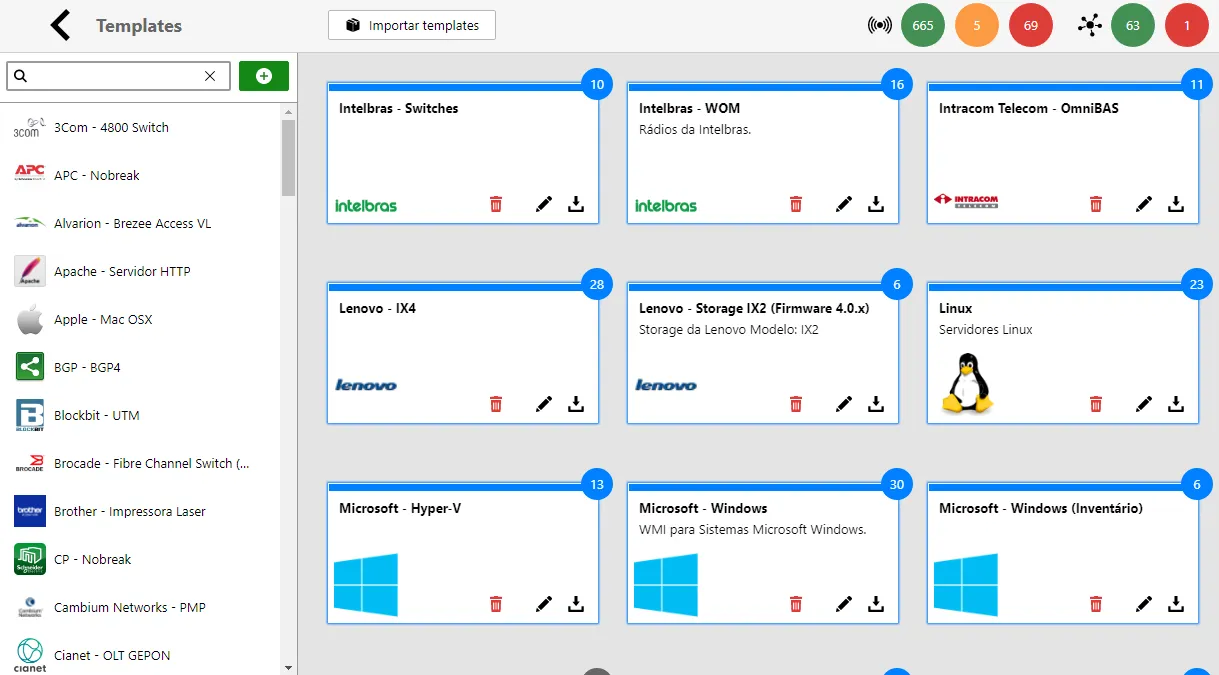
![]()
![]()
![]()
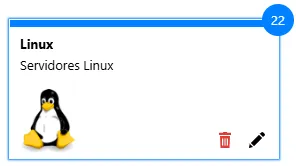
| Ícone | Descrição |
|---|---|
| Remove: Removes the highlighted template. | |
| Edit: Edits the template properties, such as name, description and icon. |
Create/Edit a Template
Section titled “Create/Edit a Template”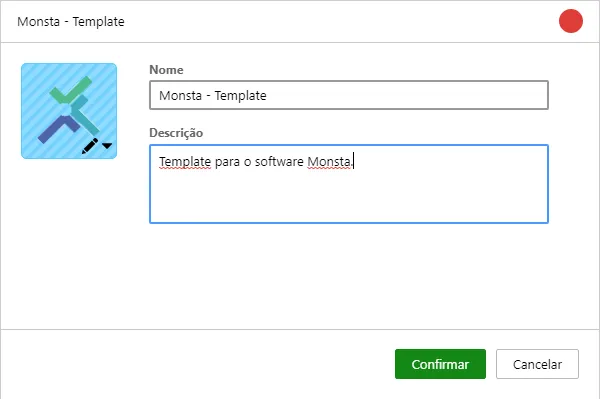
| Option | Description |
|---|---|
 | Template Icon: Allows selecting an icon for the template from an existing library or from a new image. |
| Name | Name given to the template. |
| Description | A brief description about the template. |
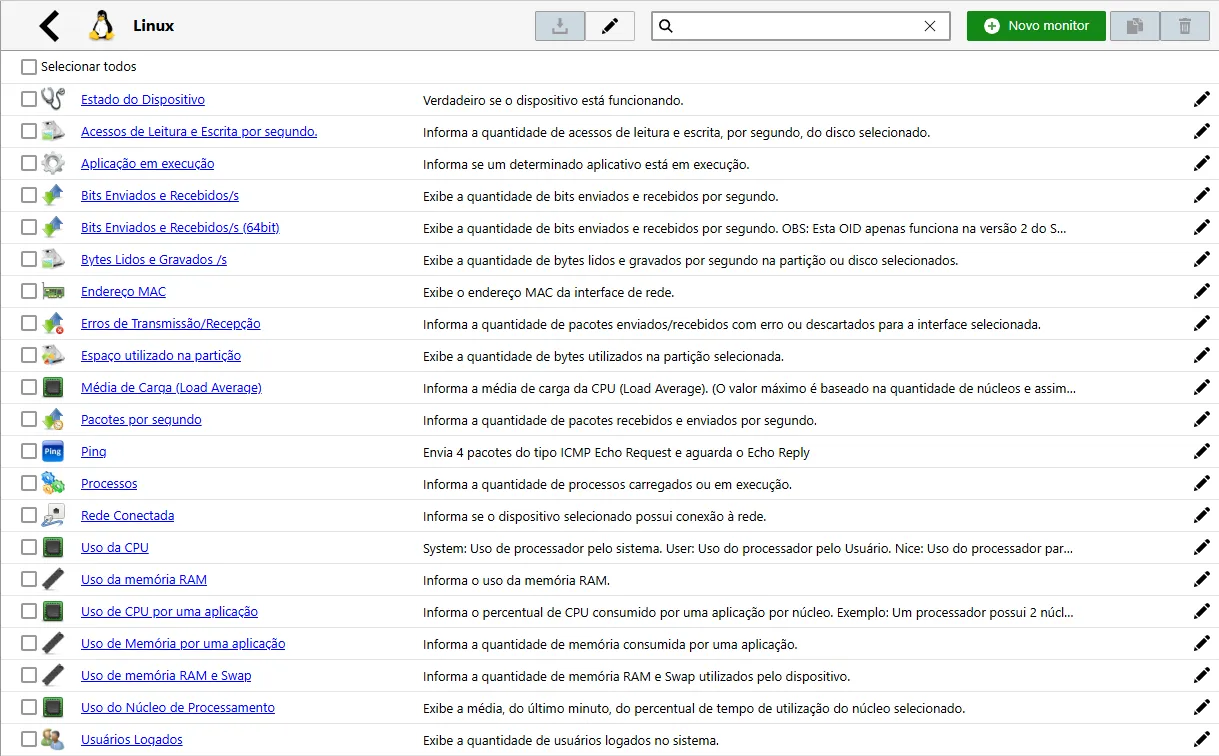
Monitors
Section titled “Monitors”Monitors are system components that check a specific resource on a device and return its current status. They are the ones that generate information and alert about possible anomalies.
![]()
![]()
![]()
![]()
![]()
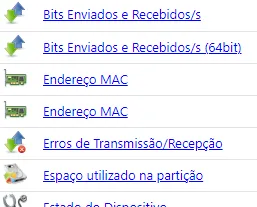
| Ícone | Descrição |
|---|---|
| Clone: Clones the monitor to a selected template. | |
| Remove: Removes the selected monitor. |
Create/Edit a Monitor
Section titled “Create/Edit a Monitor”Monitor
Section titled “Monitor”On this screen the basic information about the monitor is configured.
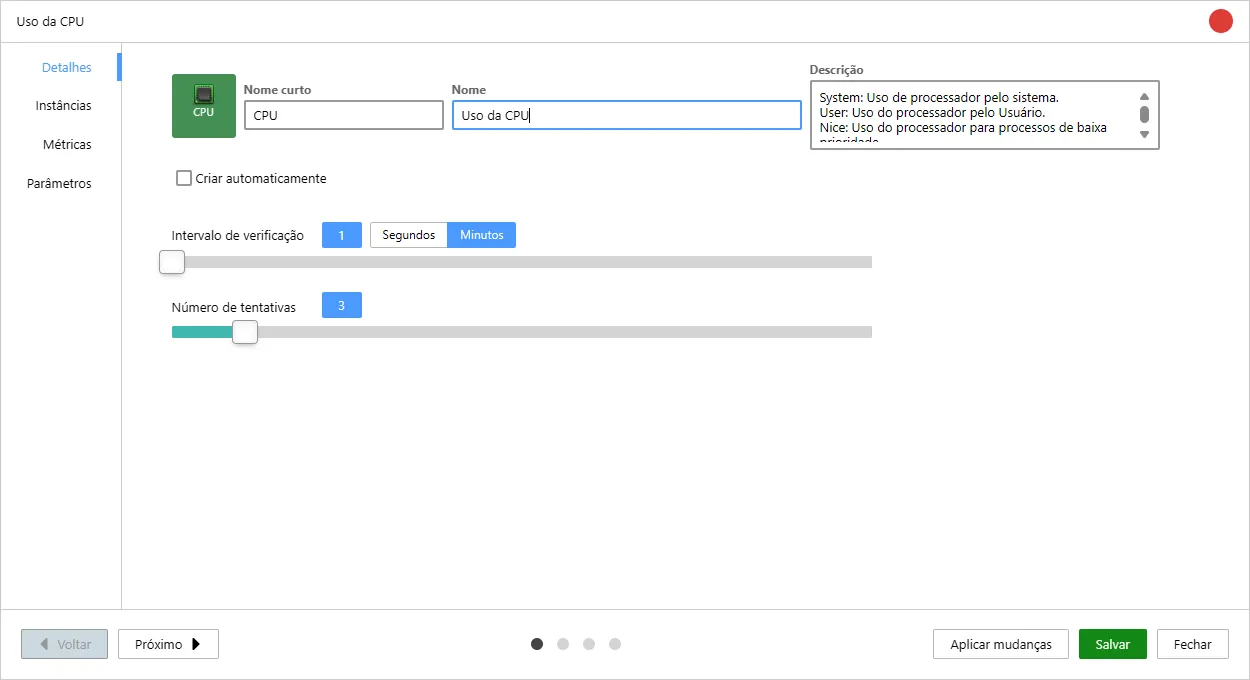
| Option | Description |
|---|---|
 | Icon: Allows selecting an icon for the template from an existing library or from a new image and also serves as a preview of how the monitor will be displayed on the screen. |
| Short Name | Information about the monitor that is shown on the devices screen icon. |
| Name | Information about the monitor that is shown on the templates screen. |
| Description | A brief information about the monitor. This text will be displayed when hovering the mouse over a device’s monitors. |
| Check Interval | Selects the monitor’s check interval. |
| Number of Attempts | Number of checks that will be made after the monitor’s value exceeds its normal limit before changing its state. |
| When editing a monitor and clicking this button, the system allows replicating the changes to other devices simultaneously. After clicking, select from the list the devices that should receive the new configuration. |
Instances
Section titled “Instances”On this screen the listing method for resource instances is specified, such as the list of network interfaces of a device.
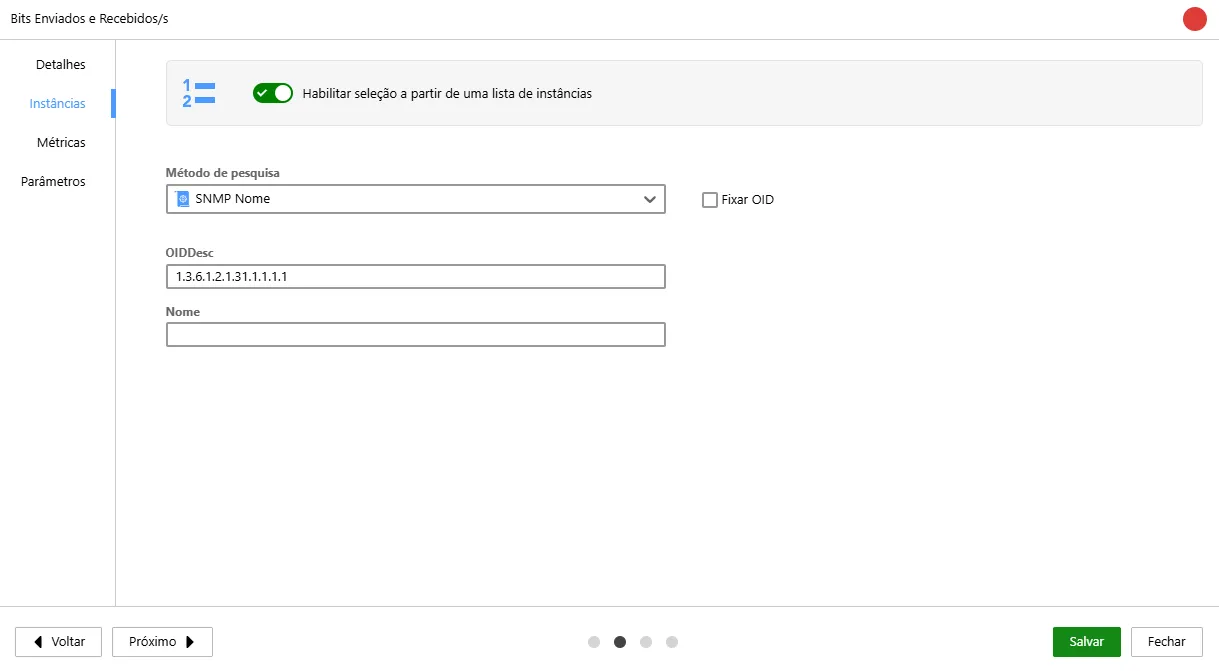
| Option | Description |
|---|---|
| Enable Instances: Enables instance selection for the monitor. | |
| Search method used to find the instances. | |
| Fix OID | When disabled, Monsta checks if the instance name remains at the same OID. The following situations may occur: - Same OID: Monsta collects the values in the same position; - Different OID: Monsta discovers the new OID and will collect the values in the new position; When enabled, Monsta will always collect the information at the same position, regardless of whether the instance changed OID. |
| OIDDesc and Name | This option allows the monitor to automatically identify multiple components of the same device (such as different network interfaces, disks, or partitions). The system uses Monsta Studio scripts to list these items. In the parameters, you define the desired properties (like OIDs or filters) to extract exactly the data that will be shown in the selection list. |
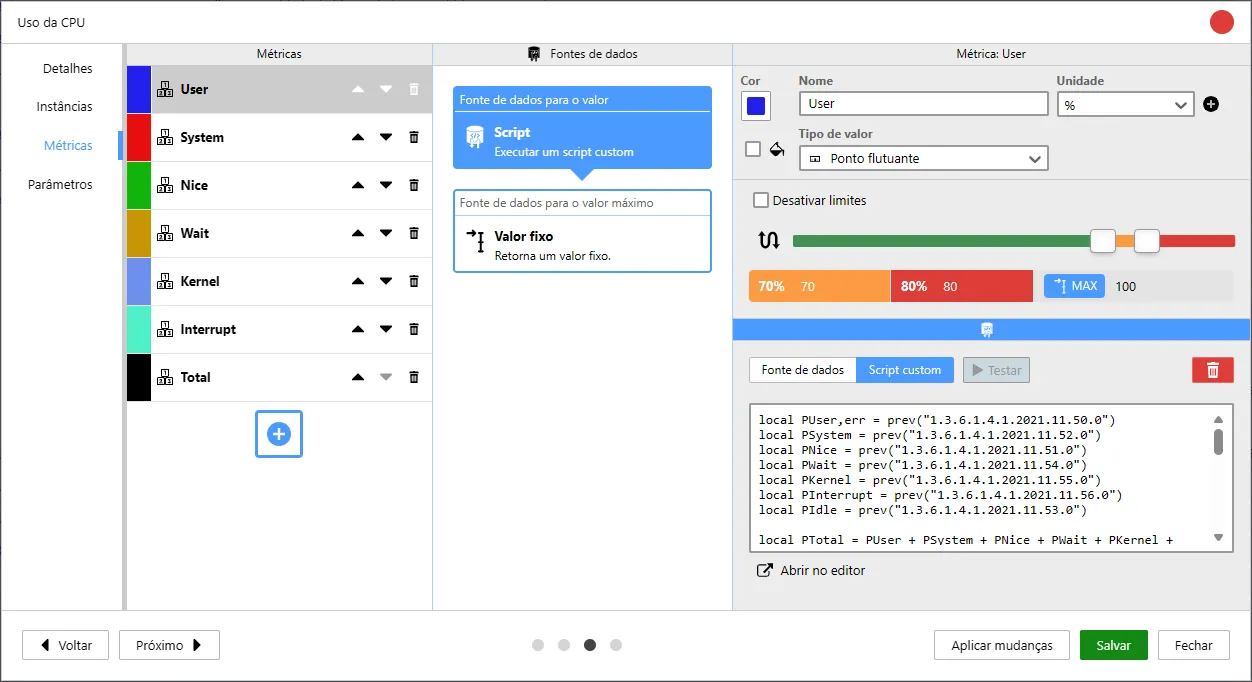
Metrics
Section titled “Metrics”On this screen the method of collecting the device resources is configured.
![]()
| Ícone | Descrição |
|---|---|
| Ordering: Toggles the metric’s position to be drawn on the chart. | |
| Remove: Removes the selected metric. |

![]()
![]()
![]()
![]()
![]()
![]()
| Option | Description |
|---|---|
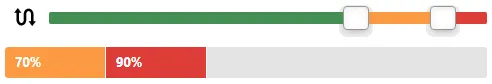
| Invert: Inverts the alert percentage. By default a lower value will be considered better. | |
 | Percentage Bar: Allows visually configuring the alert thresholds. Drag the selectors to determine the usage percentages that trigger the “Warning” and “Critical” states. |
| Percentage Values: Below the percentage bar, the system displays the exact numeric value corresponding to the marker positions. |
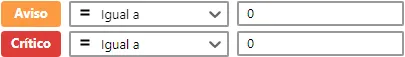
| Option | Description |
|---|---|
| Warning Value: Defines the condition for the metric to enter the warning state. | |
| Critical Value: Defines the condition for the metric to enter the critical state. |
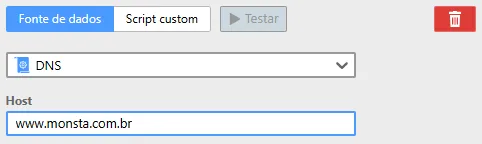
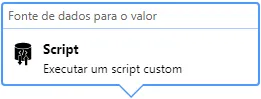
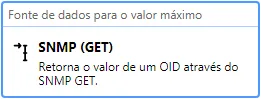
| Option | Description |
|---|---|
| Test Button: Tests the source against a selected device. | |
| Remove Button: Removes the data source from the highlighted value. | |
| Collector | Collector Field: Selects the method that will be used to collect the monitor’s data. |
| Parameters | Parameters Field: Allows entering data for the selected parameters. Parameters with a ”*” next to them indicate that filling them in when adding a monitor will be mandatory. |
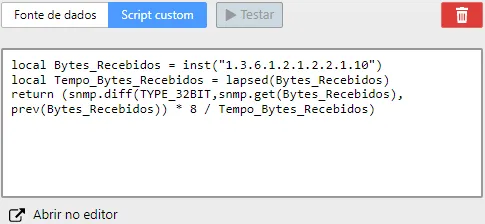
| Option | Description |
|---|---|
| Test Button: Tests the script against a selected device. | |
| Remove Button: Removes the data source from the highlighted value. | |
| Open in Editor | Open in Editor Button: Opens an advanced development editor for the script. |
Parameters
Section titled “Parameters”On this screen it is possible to create parameters with predefined values to be used by metrics’ data sources. This option is useful when a monitor has multiple metrics that use the same information, such as a username and password for authentication, for example.
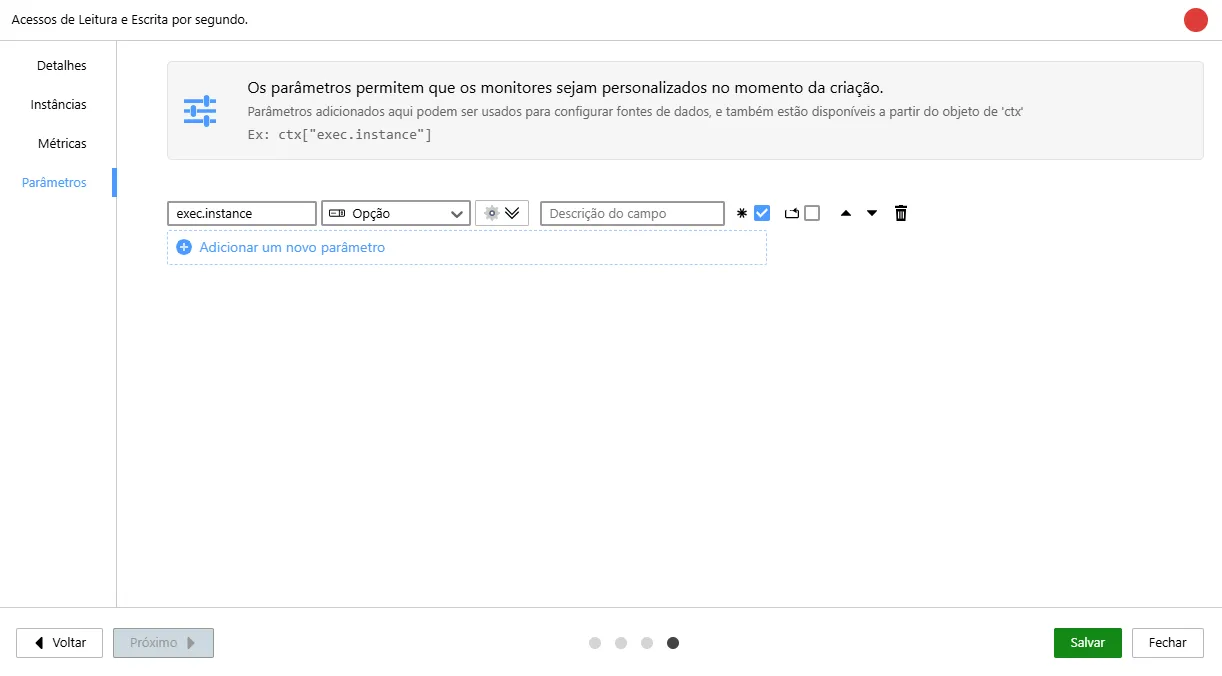
| Option | Description |
|---|---|
| Name: Defines a name for the parameter. | |
| Type: The type of information the parameter should receive. The “Option” type will bring a list coming from the “Instances” tab. | |
| Default Value: Sets a default value for the parameter when creating the monitor. This option is not available for the “Option” type. | |
| Field Description: The text that will be shown to the user when adding monitors to devices. | |
| Required Field Option: Requires the parameter to have some value. Empty fields are not allowed. | |
| Repeatable Field Option: Allows the user to insert the same field multiple times with different values. | |
| Position: Toggles the parameter’s position in the listing. | |
| Remove Button: Removes the selected parameter. |
Example:
local opts = {    host = "192.168.1.1",    username = "user",    password = "password",    command = "ls /backup/*.sql"}local ret = {}
local list = string.split(ssh.exec(opts),"\n")
for i, arq in pairs(list)do  local name = string.split(arq,"//")[2]  table.insert(ret,{display=name,instanceId=i})end
return ret