Options
Global device options
Section titled “Global device options”![]()
Collection
Section titled “Collection”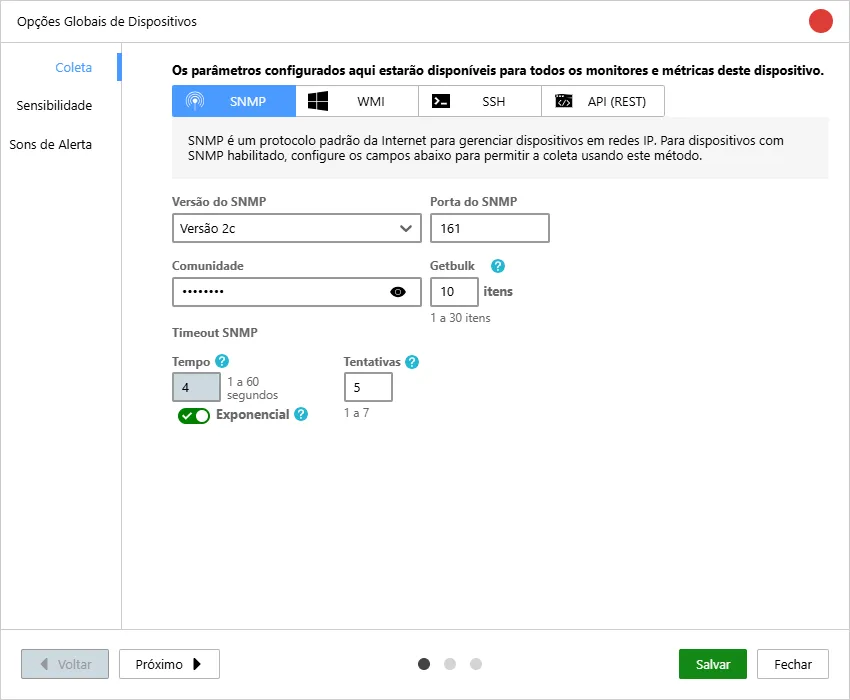
Communication Parameters (SNMP, WMI and SSH): Centralize access credentials and communication ports. By configuring SNMP communities or SSH/WMI users globally, new devices will be monitored automatically without the need to enter passwords manually for each one.
Sensitivity
Section titled “Sensitivity”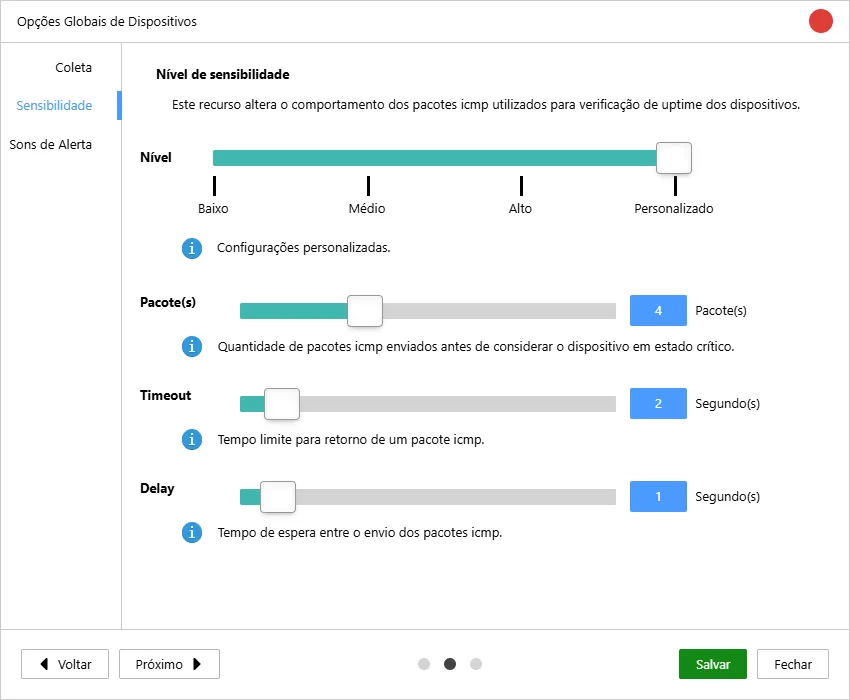
Uptime Sensitivity: Defines the tolerance criteria to consider a device as “offline”. Adjusting the global sensitivity allows you to determine how many connectivity tests must fail before the system triggers a down alert, avoiding false alarms in networks with momentary fluctuations.
| Level | Predefined patterns can be used or customize each item. |
|---|---|
| Packet(s) | How many packets will be sent to the equipment before considering it critical in case of no response. |
| Timeout | How long Monsta will wait for each sent ping before considering it as not received. |
| Delay | After the previous packet is received or times out, how long Monsta should wait before sending the next request. Packets to check uptime are terminated upon receiving a reply. For monitoring the ping time on a device, all packets will be sent and an average time will be returned. |
Alert Sounds
Section titled “Alert Sounds”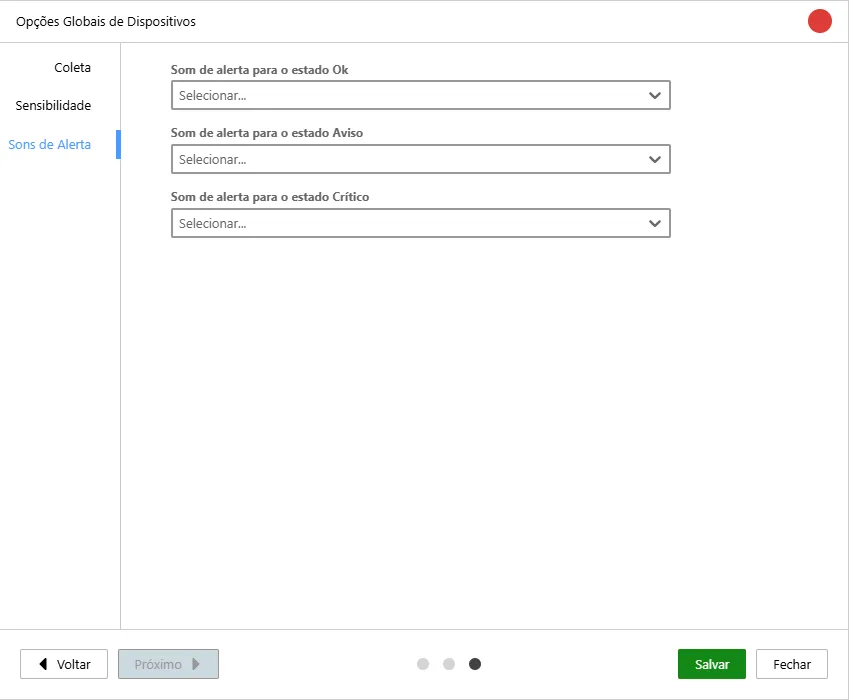
Custom Alert Sounds: Configure the sound experience of the Operations Center (NOC). You can set different audio for the Normal, Warning, and Critical states. This inheritance ensures the entire interface maintains a cohesive sound pattern, facilitating the immediate identification of an event’s severity by the technical team.
Display Options
Section titled “Display Options”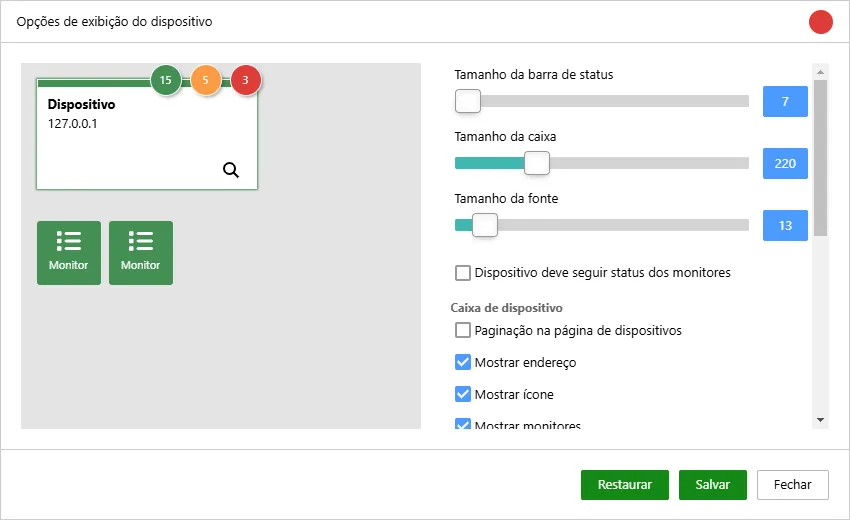
Monsta allows you to configure the level of visual detail of your assets, prioritizing the information that is most strategic for your daily operations:
- Dimension Adjustment: Control the size of device and monitor boxes, allowing greater information density on small screens or better visibility on monitoring dashboards (NMS).
- Dynamic Label Configuration: You can choose what each monitor highlights on the main screen:
- Monitor Name: Ideal for quick identification of the service or parameter being observed (e.g., “CPU Temperature”).
- Current Collected Value: Displays the exact collected data in real time (e.g., “45°C”), allowing you to track critical metrics without opening the monitor details.
- Text and Image Scaling: Customize the font and image sizes in the monitors to ensure information is legible according to the chosen layout, adapting both to individual desktop use and large operation center screens.
| Item | Description |
|---|---|
| Status bar size | Defines the size of the bar displayed at the top related to the device status. |
| Box size | Defines the size of the device box. |
| Font size | Sets the font size of the device name. |
| Device should follow monitors’ status | When this option is enabled, the device status will assume the status of the monitors, with critical being the highest priority and normal the lowest. |
| Pagination on the devices page | Displays the devices screen with pagination instead of infinite scrolling; |
| Show address | Displays the host used to monitor the device. |
| Show icon | Displays the icon assigned to the device. |
| Show monitors | Displays the count of monitors at the top of the device box. |
| Show animation | Enables animation of the device box when it changes status. |
| Monitor box | Allows the user to change the size of the monitor boxes. |
| Font size | Allows the user to change the font size of the monitor text. |
| Spacing between boxes | Allows the user to change the space between monitor boxes. |
| Icon size | Allows the user to change the size of the icon displayed in the monitor boxes. |
| Monitor display mode | Allows selecting the type of information that should appear on the monitor, name or last reading value. |